
Key takeaways
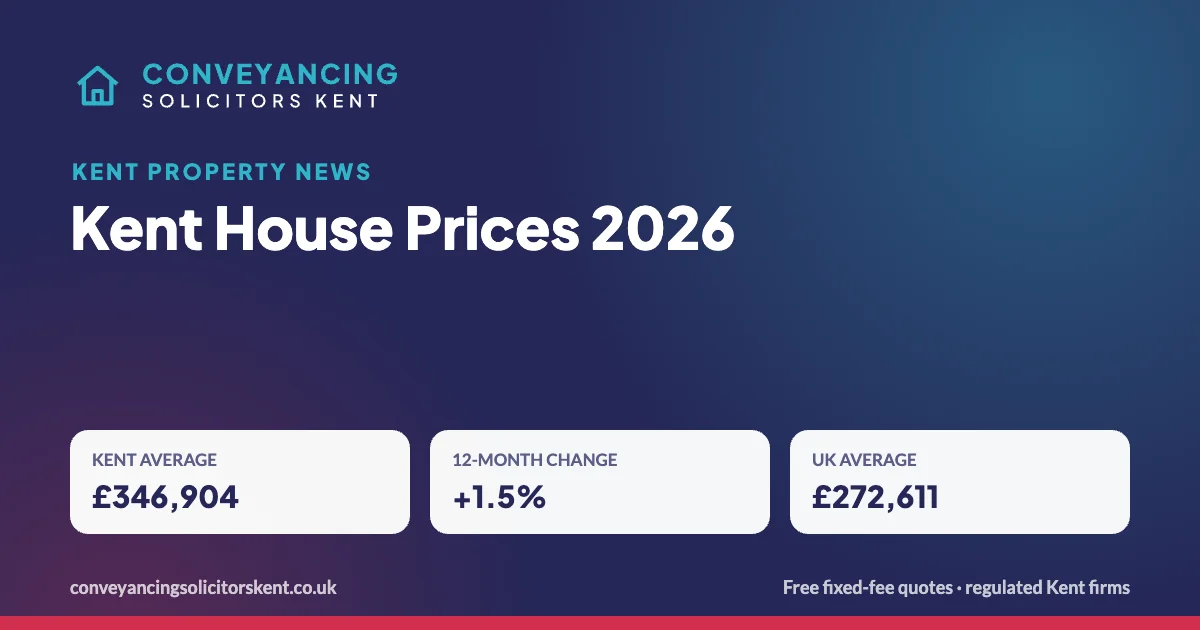
- The average Kent home cost £346,904 in July 2026, up 1.5% (about £5,040) on a year earlier.
- Prices rose 0.2% between June and July 2026.
- The UK average was £272,611, up 1.4% over the year (UK House Price Index).
- Gravesham, Canterbury, Swale and Dover saw some of the biggest rises in cash terms.
- Eleven of Kent’s 13 local authority areas saw prices rise over the year.
Kent house prices at a glance
| Measure (July 2026) | Figure |
|---|---|
| Kent average price | £346,904 |
| Change over 12 months | +1.5% (about £5,040) |
| Change from June 2026 | +0.2% |
| UK average price | £272,611 |
| UK change over 12 months | +1.4% |
Kent remains well above the UK average, and prices are rising at a similar, modest pace.
Which Kent areas rose most?
Ranked by the cash rise over the 12 months to July 2026, these were the strongest areas:
| Area | Average price | 12-month change |
|---|---|---|
| Gravesham | £344,923 | +3.3% (+£11,179) |
| Canterbury | £337,454 | +2.9% (+£9,640) |
| Swale | £298,985 | +3.2% (+£9,321) |
| Dover | £277,750 | +2.7% (+£7,363) |
| Tonbridge & Malling | £407,880 | +1.4% (+£5,607) |
Eleven of Kent’s 13 local authority areas, including Medway, saw prices rise over the year, while two saw small falls. Prices in individual towns and streets can differ a lot from these district averages.
What it means if you’re selling
Modest growth means pricing matters. Look at what similar homes nearby actually sold for using the GOV.UK house price search, rather than asking prices alone. Having your documents ready and instructing a solicitor when you list helps you keep a buyer once you find one.
What it means if you’re buying
Budget for more than the price. Alongside your deposit, allow for legal fees, searches and stamp duty. See our guide to conveyancing costs in Kent, and our tips on negotiating a house price.
Where the figures come from
The UK and Kent figures come from the official UK House Price Index, produced by the ONS and HM Land Registry. The district figures were published by KentOnline in September 2026, from Purplebricks’ analysis of ONS data. House price figures are published monthly, about two months in arrears, and can be revised.
FAQs
Kent house prices: FAQs
What is the average house price in Kent?
£346,904 in July 2026, based on ONS data. That is well above the UK average of £272,611.
Are Kent house prices rising?
Yes, modestly. Kent house prices rose 1.5% in the 12 months to July 2026, and 0.2% between June and July.
Which part of Kent saw the biggest rise?
In cash terms, Gravesham, where the average rose by £11,179 (3.3%) in the year to July 2026. Canterbury, Swale and Dover also saw rises of around 3%.
How often are house price figures updated?
Every month. The UK House Price Index is published by the ONS and HM Land Registry, usually about two months after the month it covers.
Related
Related guides
Sources for these Kent house prices: UK House Price Index (HM Land Registry) · KentOnline, September 2026 · Search house prices (GOV.UK)
Ready when you are
Moving home in Kent? Get your quote today.
Free, fixed fees and no obligation.